Uber Eats Merchant & Menu Analysis
Introduction
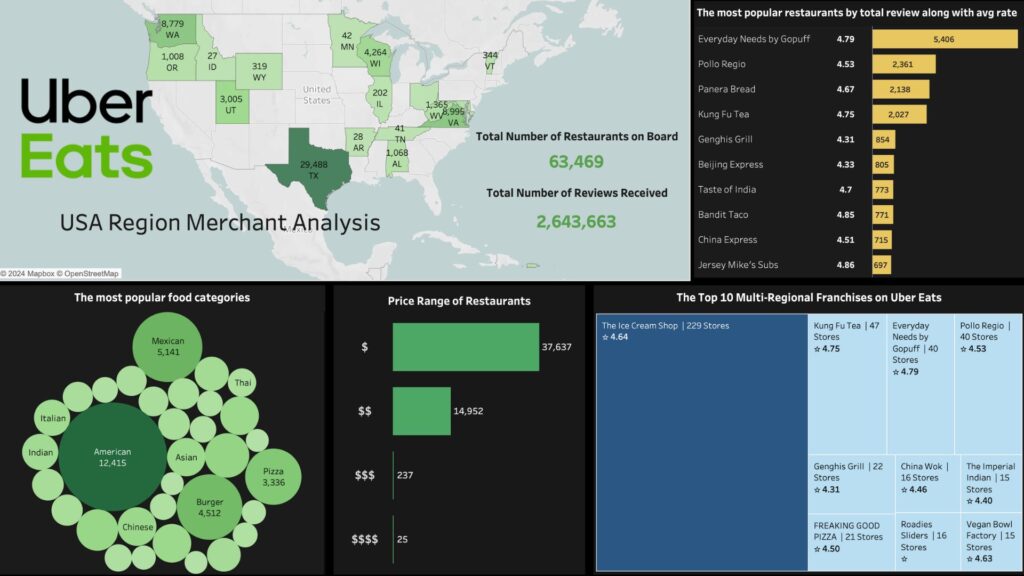
In this project, I leveraged my technical skills and business acumen to create a comprehensive dashboard for Uber Eats USA.
After cleaning and organizing the datasets, I identified areas for growth and strategic improvements. This included pinpointing high-demand menu items, underperforming areas, and opportunities for market expansion.
Lastly, I came up with 2 actionable business ideas for Uber Eats which can potentially help expand their customer base and drive growth.
Key Highlights
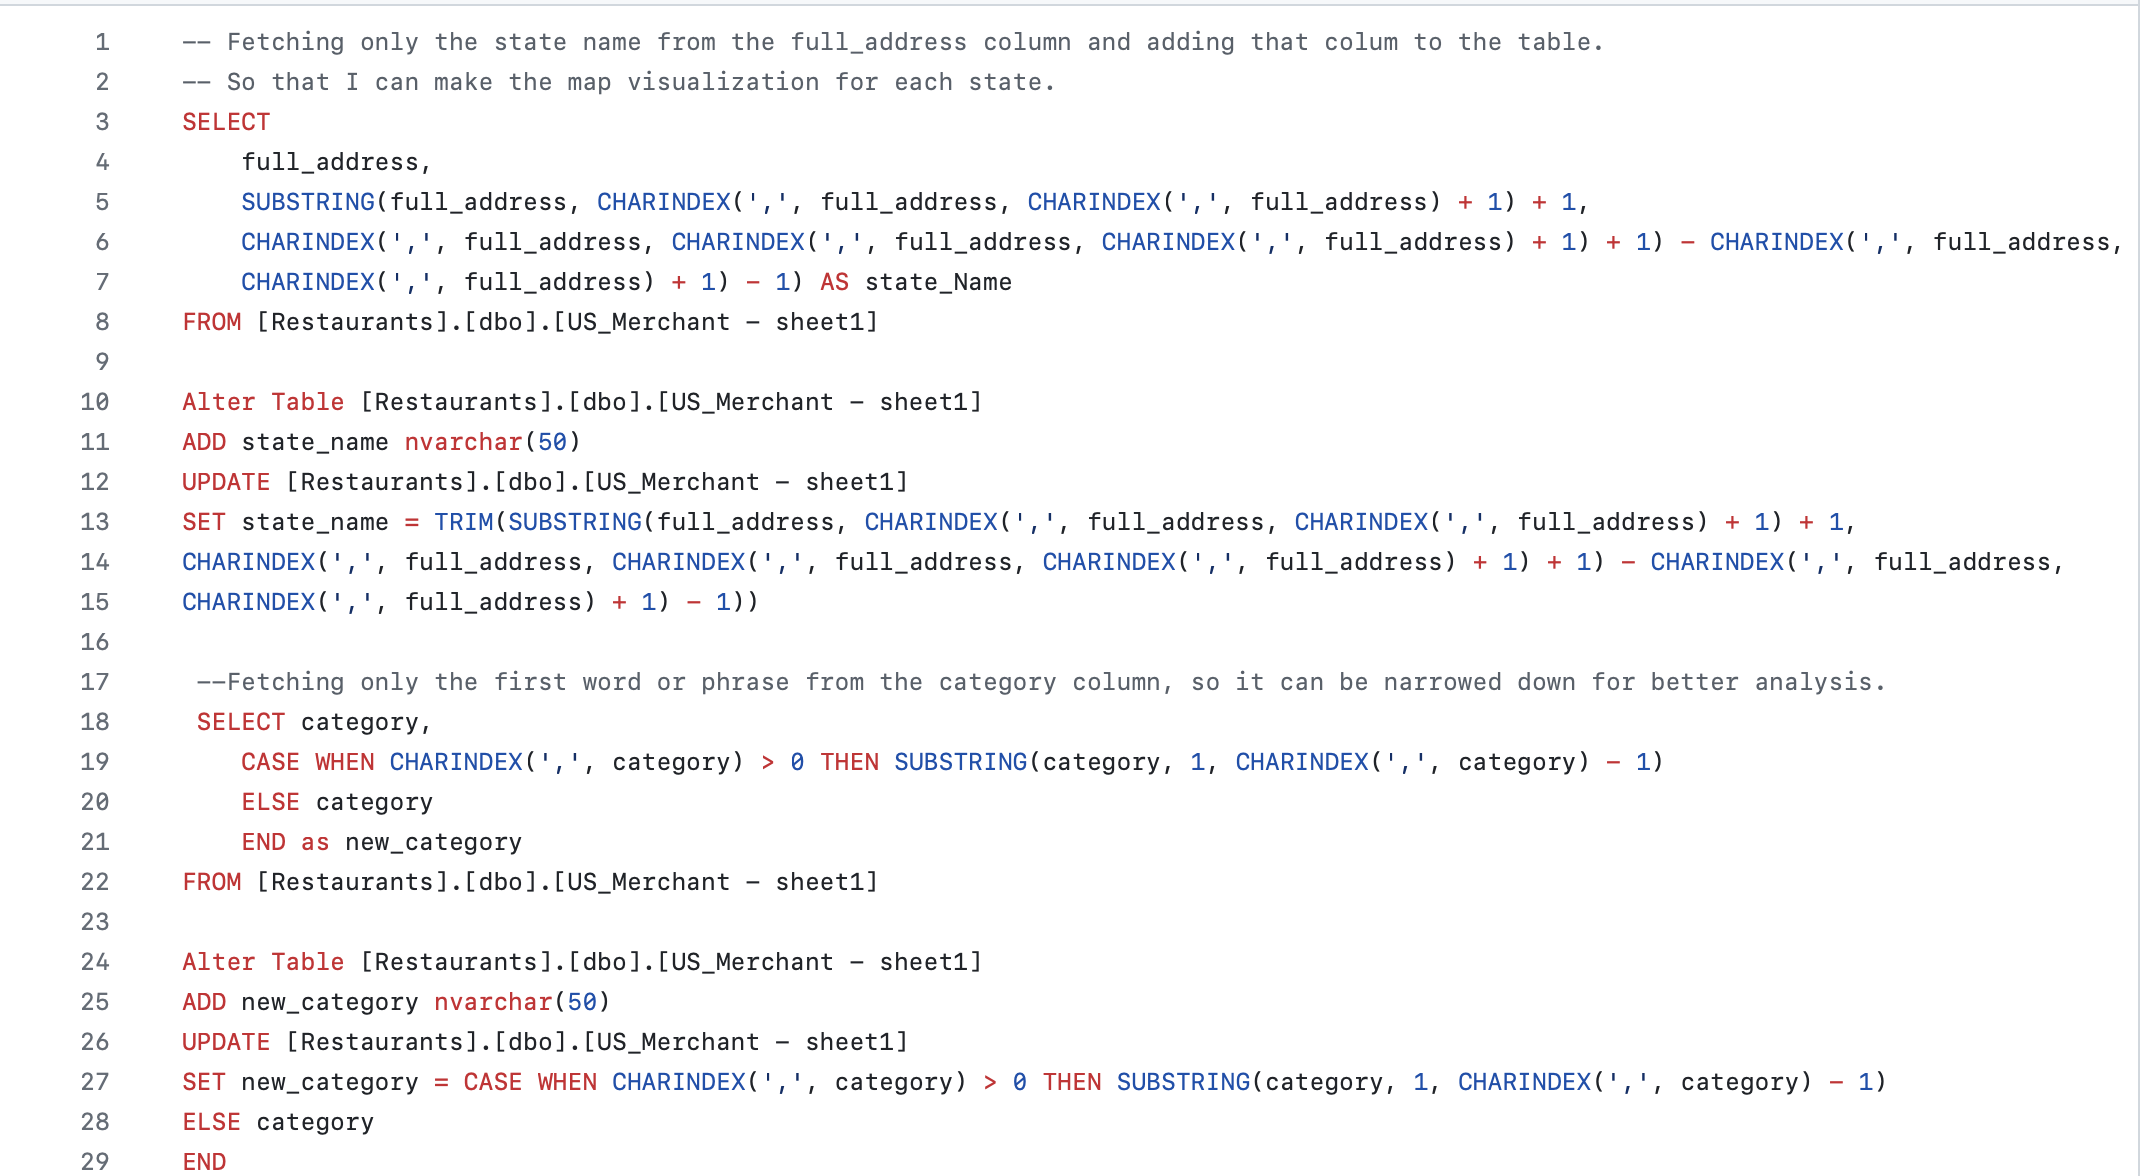
Utilized SQL to conduct a data manipulation and cleaning process such as fetching only specific words from a column for comprehensive data visualization.
Derived actionable business insights from the visualization.
- Recommended 2 implementable business strategies fro Uber Eats .
Data Cleaning & Preparation SQL
- Fetched only state name for every merchant from address column.
- Derived only the first word from the category column to narrow down on the category.
- To make city specific visualization, fetched only city name from address .
Data Visualization
TABLEAU
Deriving Business Insights from Houston city's data
Business Insight #1
Number of restaurants covering per zip code in Houston.
Market Penetration – Areas with low coverage but high population density might represent untapped market potential, signaling opportunities for strategic merchant development to attract more customers and increased order volume.
Demand Forecasting – Areas with a higher concentration of restaurants might indicate higher demand for delivery services, whereas areas with fewer restaurants might present opportunities for expansion or targeted marketing efforts to increase demand.
Strategic Partnership – By leveraging this data to identify potential strategic partnerships or collaborations with restaurants in underserved areas. Offering incentives or support to restaurants in these areas can help Uber Eats expand its presence and capture market share.

Business Insight #2
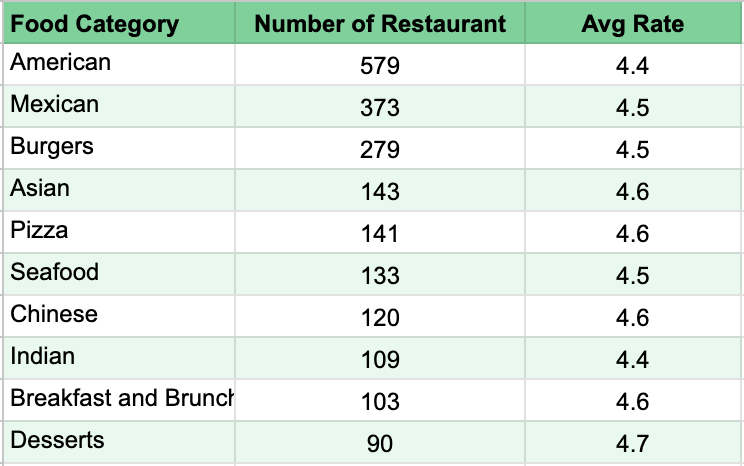
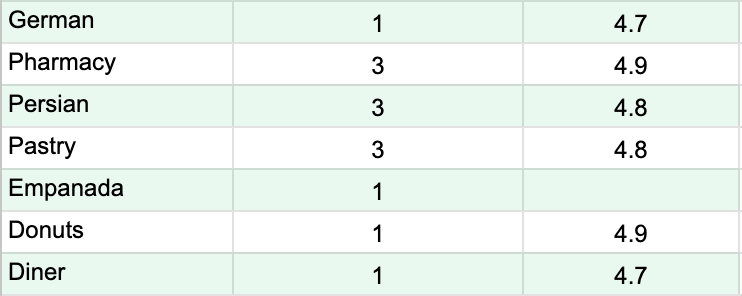
Total Restaurants vs Avg Rate for each category in Houston.
Merchants Diversification – The Categories that are highly rated but has fewer number of restaurants indicate that the customer’s potential interest and the need for market development in that category.
Quality Assessment – The categories that were poorly rated address the need of evaluation on merchants to pin point the areas of service in which customers are dissatisfied.
Customer Preferences – Categories with a higher number of restaurants may indicate popular cuisine types or dining preferences among Houston residents, allowing Uber Eats to tailor its services and marketing efforts accordingly.
Business Insight #3
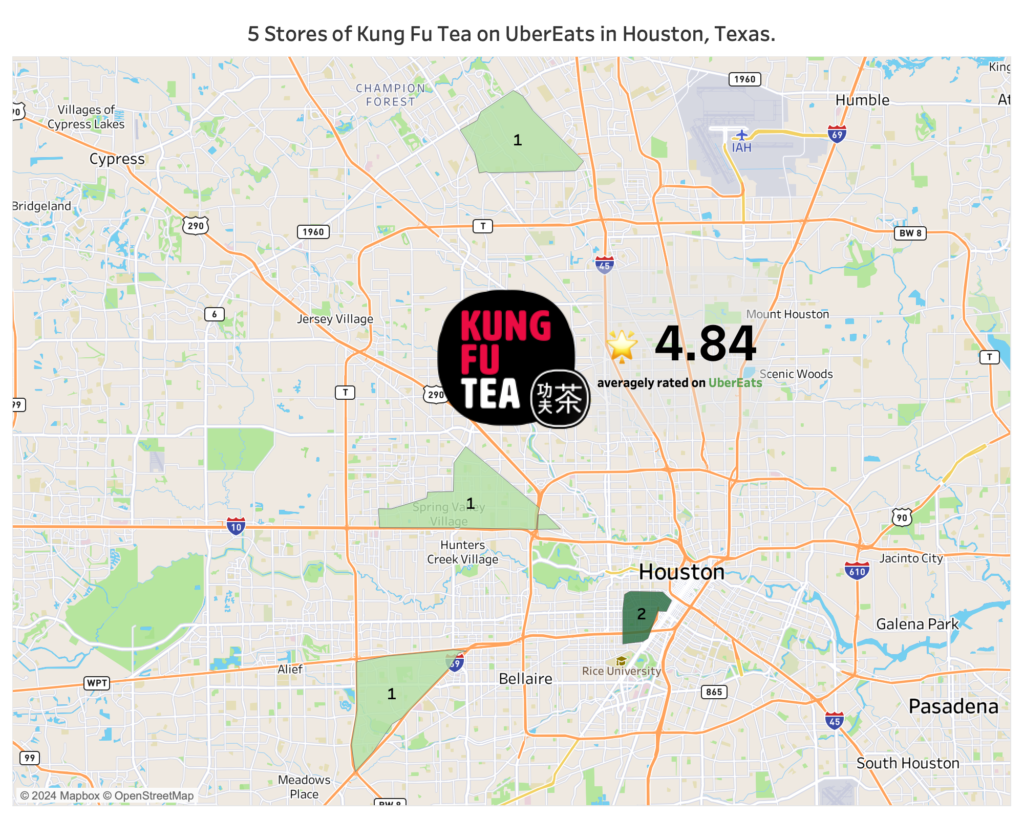
Kung Fu Tea x Uber Eats in Houston
Predicting customer taste – By looking at the average rate of Kung Fu Tea, customers are highly satisfied with having Kung Fu Tea on Uber Eats.
Merchant Development– By evaluating the merchants’s store location cooperated with UberEats, predicts the possibility of future opportunities of having more Kung Fu stores on board in underserved areas.
Implementable Business Strategy offerings for Uber Eats
Business strategy offering #1
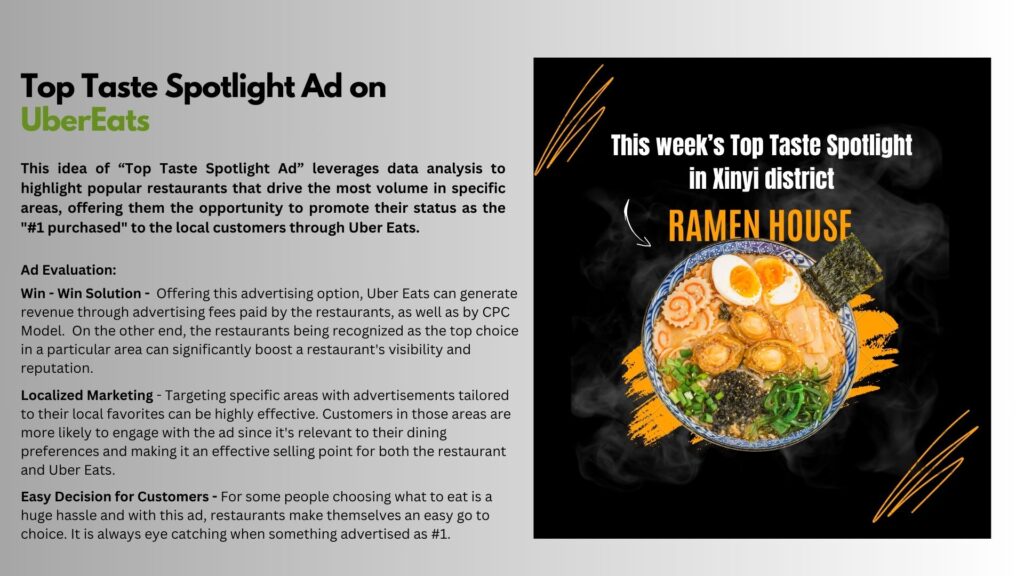
Business strategy offering #2
